Pacotes

library(tidyverse)
Warning: package 'tidyverse' was built under R version 4.1.3
Warning: package 'tibble' was built under R version 4.1.3
Warning: package 'tidyr' was built under R version 4.1.3
Warning: package 'readr' was built under R version 4.1.3
Warning: package 'purrr' was built under R version 4.1.3
Warning: package 'dplyr' was built under R version 4.1.3
Warning: package 'stringr' was built under R version 4.1.3
Warning: package 'forcats' was built under R version 4.1.3
Warning: package 'lubridate' was built under R version 4.1.3
-- Attaching core tidyverse packages ------------------------ tidyverse 2.0.0 --
v dplyr     1.1.1     v readr     2.1.4
v forcats   1.0.0     v stringr   1.5.0
v ggplot2   3.4.2     v tibble    3.2.1
v lubridate 1.9.2     v tidyr     1.3.0
v purrr     1.0.1     
-- Conflicts ------------------------------------------ tidyverse_conflicts() --
x dplyr::filter() masks stats::filter()
x dplyr::lag()    masks stats::lag()
i Use the conflicted package (<http://conflicted.r-lib.org/>) to force all conflicts to become errors
library(gsheet)
library(broom)
Warning: package 'broom' was built under R version 4.1.3
library(metafor)
Carregando pacotes exigidos: Matrix
Warning: package 'Matrix' was built under R version 4.1.3

Attaching package: 'Matrix'

The following objects are masked from 'package:tidyr':

    expand, pack, unpack

Carregando pacotes exigidos: metadat
Carregando pacotes exigidos: numDeriv

Loading the 'metafor' package (version 4.2-0). For an
introduction to the package please type: help(metafor)
library(dplyr)
library(ggthemes)
Warning: package 'ggthemes' was built under R version 4.1.3
library(plyr)
Warning: package 'plyr' was built under R version 4.1.3
------------------------------------------------------------------------------
You have loaded plyr after dplyr - this is likely to cause problems.
If you need functions from both plyr and dplyr, please load plyr first, then dplyr:
library(plyr); library(dplyr)
------------------------------------------------------------------------------

Attaching package: 'plyr'

The following objects are masked from 'package:dplyr':

    arrange, count, desc, failwith, id, mutate, rename, summarise,
    summarize

The following object is masked from 'package:purrr':

    compact
library(janitor)

Attaching package: 'janitor'

The following objects are masked from 'package:stats':

    chisq.test, fisher.test
library(metafor)
library(cowplot)
Warning: package 'cowplot' was built under R version 4.1.3

Attaching package: 'cowplot'

The following object is masked from 'package:ggthemes':

    theme_map

The following object is masked from 'package:lubridate':

    stamp
library(rio)
ma = gsheet2tbl("https://docs.google.com/spreadsheets/d/1WVUeXTH_o9kTgryR1ZszdNFJjWt_PegmhxclXVSXVgk/edit?usp=sharing")
head(ma)

Descritivo

Rendimento

labels <- c("BIX+PROT+TRIFL" = "BIX+PROT+TRIFL", "_CHECK" = "Non-treated", "FLUX+PYRA" = "FLUX+PYRA")

yield = ma %>% 
  filter(ai %in% c("BIX+PROT+TRIFL", "_CHECK", "FLUX+PYRA")) %>% 
  ggplot(aes(yld))+
  geom_histogram(color = "white", fill = "darkred")+
  facet_wrap(~ai,labeller = labeller(ai = labels))+
  theme_few()+
  labs(x = "Yield (kg/ha)",
       y = "Frequency")+
  theme(text = element_text(face = "bold",size = 14))

ggsave("fig/yield.png", bg = "white", width = 10, height = 8)
`stat_bin()` using `bins = 30`. Pick better value with `binwidth`.
Warning: Removed 49 rows containing non-finite values (`stat_bin()`).

Rendimento x Ano

yield_year = ma %>% 
  filter(ai %in% c("BIX+PROT+TRIFL", "_CHECK", "FLUX+PYRA")) %>% 
  ggplot(aes(as.factor(year),yld))+
  #geom_histogram(color = "white", fill = "darkgreen")+
  geom_boxplot(fill = NA, color = "black", size = 1)+
  facet_wrap(~ai,labeller = labeller(ai = labels))+
  theme_few()+
  labs(x = "Year",
       y = "Yield (kg/ha)")+
  #coord_flip()+
  theme(text = element_text(face = "bold",size = 14),
        strip.text = element_blank())

ggsave("fig/yield_year.png", bg = "white", width = 10, height = 8)
Warning: Removed 49 rows containing non-finite values (`stat_boxplot()`).

Plot

plot_grid(yield,yield_year, labels = c("AUTO"), ncol = 1)
`stat_bin()` using `bins = 30`. Pick better value with `binwidth`.
Warning: Removed 49 rows containing non-finite values (`stat_bin()`).
Warning: Removed 49 rows containing non-finite values (`stat_boxplot()`).

Severidade

severity = ma %>% 
  filter(ai %in% c("BIX+PROT+TRIFL", "_CHECK", "FLUX+PYRA")) %>% 
  ggplot(aes(sev))+
  geom_histogram(color = "white", fill = "darkgreen")+
  facet_wrap(~ai,labeller = labeller(ai = labels))+
  theme_few()+
  labs(x = "Severity (%)",
       y = "Frequency")+
  theme(text = element_text(face = "bold",size = 14))

ggsave("fig/severity.png", bg = "white", width = 10, height = 8)
`stat_bin()` using `bins = 30`. Pick better value with `binwidth`.
Warning: Removed 16 rows containing non-finite values (`stat_bin()`).

Severidade x Ano

severity_year = ma %>% 
  filter(ai %in% c("BIX+PROT+TRIFL", "_CHECK", "FLUX+PYRA")) %>% 
  ggplot(aes(as.factor(year),sev))+
  #geom_histogram(color = "white", fill = "darkgreen")+
  geom_boxplot(fill = NA, color = "black", size = 1)+
  facet_wrap(~ai,labeller = labeller(ai = labels))+
  theme_few()+
  labs(x = "Year",
       y = "Severity (%)")+
  #coord_flip()+
  theme(text = element_text(face = "bold",size = 14),
        strip.text = element_blank())

ggsave("fig/severity_year.png", bg = "white", width = 10, height = 8)
Warning: Removed 16 rows containing non-finite values (`stat_boxplot()`).

Plot

plot_grid(severity,severity_year, labels = c("AUTO"), ncol = 1)
`stat_bin()` using `bins = 30`. Pick better value with `binwidth`.
Warning: Removed 16 rows containing non-finite values (`stat_bin()`).
Warning: Removed 16 rows containing non-finite values (`stat_boxplot()`).

ggsave("fig/frequency_boxplot_severity.png", 
       bg = "white", height = 8,width = 10)

Meta-analise

Severidade e rendimento

ma
ma1 <- ma %>% 
  #filter(ai %in% c("BIX+PROT+TRIFL", "_CHECK", "FLUX+PYRA")) %>%
  dplyr::group_by(study, year, location, state, ai) %>% 
  dplyr::summarise(mean_sev = mean(sev),
            mean_yld = mean(yld))
`summarise()` has grouped output by 'study', 'year', 'location', 'state'. You
can override using the `.groups` argument.

Regress�o - Severidade

ma_sev <- ma %>% 
  dplyr::filter(!is.na(sev)) %>% 
  dplyr::filter(!is.na(yld)) %>%
  dplyr::filter(yld>0) %>%
  dplyr::group_by(study, year) %>%  
  dplyr::select(ai, block, sev) %>%
  dplyr::group_by(study, year) %>% 
  do(tidy(aov(.$sev ~ .$ai + factor(.$block)))) %>% 
  dplyr::filter(term == "Residuals") %>% 
  dplyr::select(1,2,6) %>% 
  set_names(c("study", "year", "v_sev"))
Adding missing grouping variables: `study`, `year`

Regress�o - Rendimento

ma_yld <- ma %>% 
  dplyr::filter(!is.na(sev)) %>% 
  dplyr::filter(!is.na(yld)) %>%
  dplyr::filter(yld>0) %>% 
  dplyr::group_by(study, year) %>% 
  dplyr::select(ai, block, yld) %>% 
  dplyr::group_by(study, year) %>% 
  do(tidy(aov(.$yld ~ .$ai + factor(.$block)))) %>% 
  dplyr::filter(term == "Residuals") %>% 
  dplyr::select(1,2,6) %>% 
  set_names(c("study", "year", "v_yld"))
Adding missing grouping variables: `study`, `year`

Reunindo dados

qmr = left_join(ma_sev, ma_yld)
Joining with `by = join_by(study, year)`
ma_trial = dplyr::full_join(ma1, qmr)
Joining with `by = join_by(study, year)`

Sele��o de I.A.

ma3 = ma_trial %>% 
  filter(!is.na(mean_sev)) %>% 
  filter(!is.na(mean_yld)) %>% 
  filter(!is.na(v_sev)) %>% 
  filter(!is.na(v_yld)) %>% 
  filter(ai %in% c("BIX+PROT+TRIFL", "_CHECK", "FLUX+PYRA"))

summary(ma3)
     study            year        location            state          
 Min.   : 1.00   Min.   :2017   Length:340         Length:340        
 1st Qu.: 5.00   1st Qu.:2018   Class :character   Class :character  
 Median :10.00   Median :2020   Mode  :character   Mode  :character  
 Mean   :10.27   Mean   :2020                                        
 3rd Qu.:15.00   3rd Qu.:2022                                        
 Max.   :22.00   Max.   :2023                                        
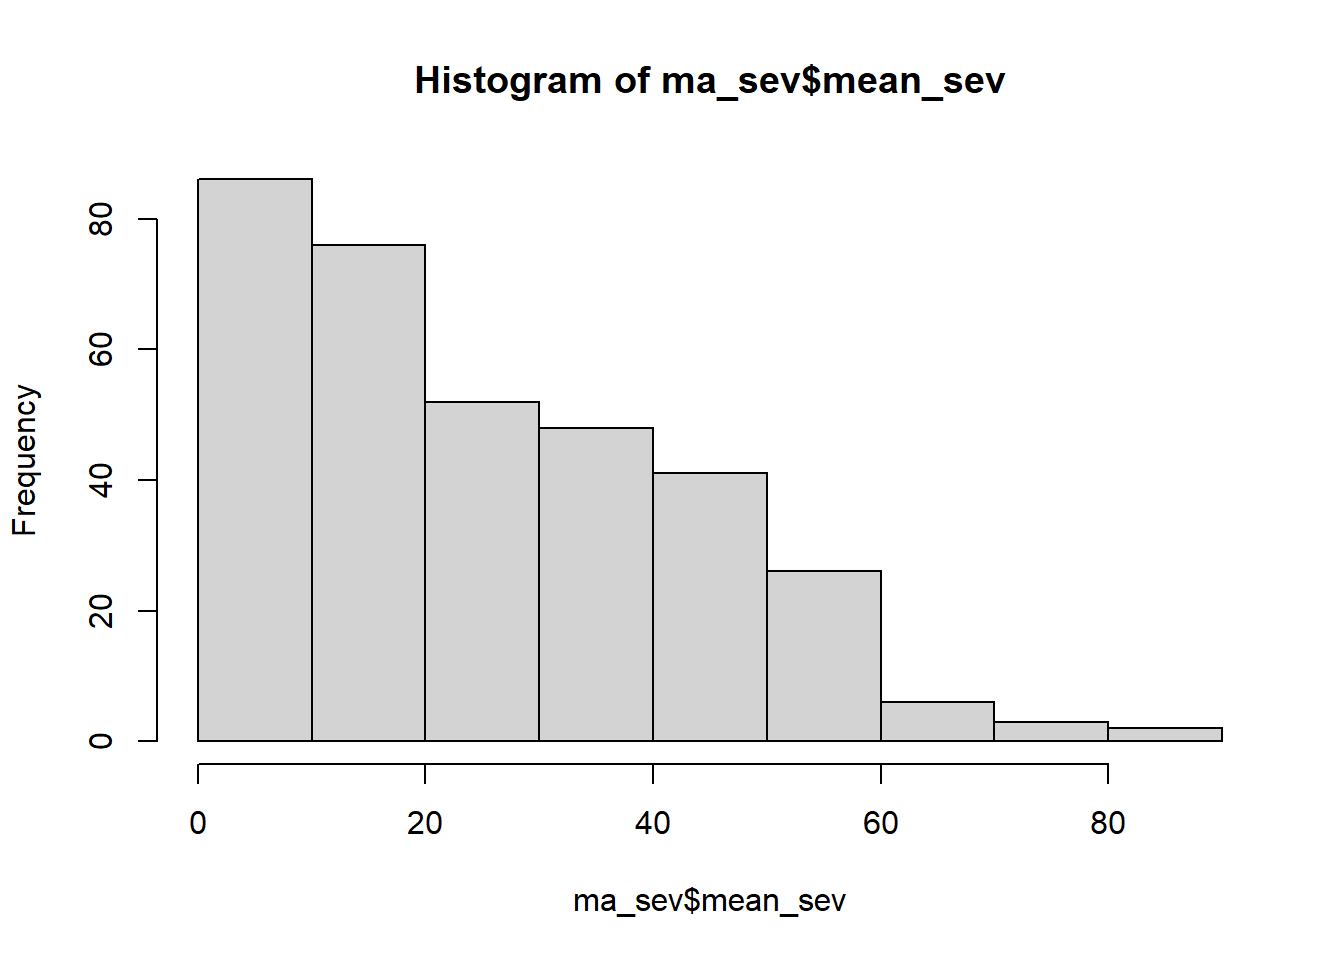
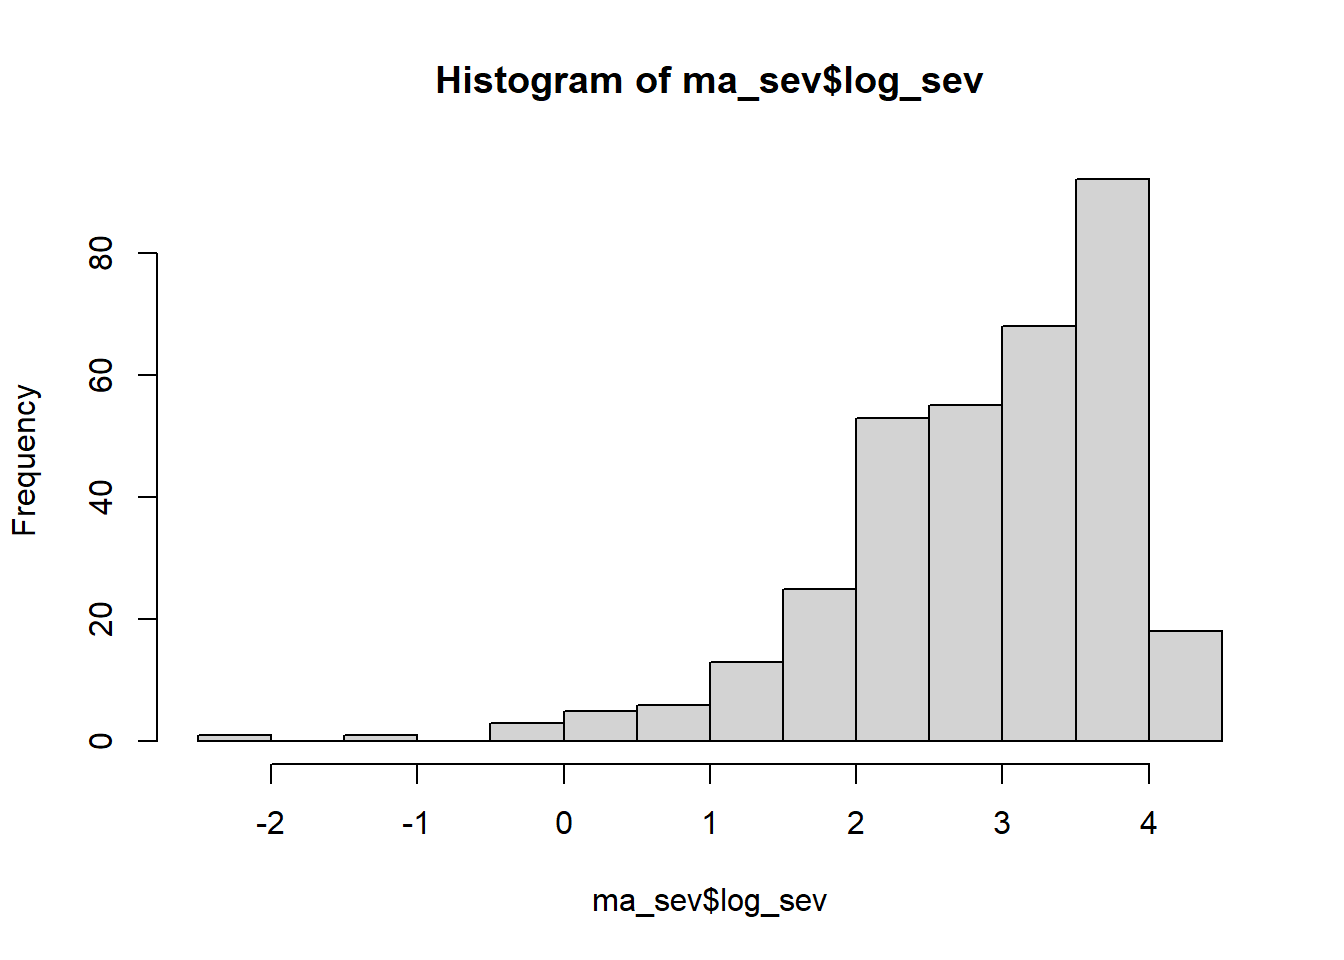
      ai               mean_sev        mean_yld        v_sev        
 Length:340         Min.   : 0.10   Min.   :1558   Min.   : 0.0000  
 Class :character   1st Qu.:10.00   1st Qu.:3282   1st Qu.: 0.9804  
 Mode  :character   Median :21.49   Median :3762   Median : 2.5969  
                    Mean   :25.27   Mean   :3747   Mean   : 6.8977  
                    3rd Qu.:38.82   3rd Qu.:4224   3rd Qu.: 8.4684  
                    Max.   :86.50   Max.   :6078   Max.   :64.2031  
     v_yld       
 Min.   :  4250  
 1st Qu.: 30921  
 Median : 51914  
 Mean   : 65616  
 3rd Qu.: 84747  
 Max.   :349261  

Renomeando I.A.

ma3$ai <- revalue(ma3$ai, c("_CHECK" = "AACHECK"))
ma3$ai <- revalue(ma3$ai, c("BIX+PROT+TRIFL" = "BIX + PROT + TRIFL"))
ma3$ai <- revalue(ma3$ai, c("FLUX+PYRA" = "FLUX + PYRA"))

ma3$study = as.factor(ma3$study)
unique(ma3$study)
 [1] 1  2  3  4  5  6  7  8  9  10 11 12 13 14 15 16 17 18 19 20 21 22
Levels: 1 2 3 4 5 6 7 8 9 10 11 12 13 14 15 16 17 18 19 20 21 22
#ma3_unique <- ma3 %>%
 # dplyr::distinct(study, .keep_all = TRUE)

ma3 = ma3 %>% # REVISAR
 dplyr::group_by(ai,study,year) %>% 
  dplyr::summarise(
    mean_yld = mean(mean_yld),
    v_yld = mean(v_yld),
    mean_sev = mean(mean_sev),
    v_sev = mean(v_sev)
  )
`summarise()` has grouped output by 'ai', 'study'. You can override using the
`.groups` argument.
ma_check = ma3 %>% 
  ungroup() %>% 
  dplyr::filter(ai == "AACHECK")%>% 
  group_by(study) %>% 
  dplyr::mutate(check = ai, sev_check = mean_sev,
                v_sev_check = v_sev, yld_check = mean_yld, v_yld_check = v_yld ) %>% 
 dplyr::select(study, yld_check, v_yld_check, sev_check, v_sev_check)

ma_check = ma_check %>% 
  filter(!is.na(yld_check)) %>% 
  filter(!is.na(v_yld_check)) %>% 
  filter(!is.na(sev_check)) %>% 
  filter(!is.na(v_sev_check))


ma_check = ma_check %>%
 dplyr::group_by(study) %>% 
  dplyr::summarise(
    yld_check = mean(yld_check),
    v_yld_check = mean(v_yld_check),
    sev_check = mean(sev_check),
    v_sev_check = mean(v_sev_check)
  )

ma_data = ma3 %>% 
  full_join(ma_check)
Joining with `by = join_by(study)`

Severidade

ma_sev <- ma_data %>% 
  filter(mean_sev != "NA") %>% 
  filter(mean_sev>0)

hist(ma_sev$mean_sev)

ma_sev <- ma_sev %>%
  mutate(log_sev = log(mean_sev))
hist(ma_sev$log_sev)

ma_sev$vi_sev <- with(ma_sev, v_sev / (4 * mean_sev^2))

summary(ma_sev$vi_sev)
    Min.  1st Qu.   Median     Mean  3rd Qu.     Max. 
0.000000 0.000399 0.001960 0.043301 0.009596 6.681174 
ma_sev = ma_sev %>% 
  filter(!is.na(mean_yld))
ma_sev <- ma_sev %>%
  filter(!is.na(mean_yld)) %>%
  filter(!is.na(mean_sev)) %>% 
  group_by(study) %>% 
  dplyr::mutate(n2 = n()) %>% 
  filter(n2 != 1)

unique(ma_sev$n2)
[1] 17 18 15 14  7  4
summary(ma_sev)
      ai                study          year         mean_yld   
 Length:340         2      : 18   Min.   :2017   Min.   :1558  
 Class :character   3      : 18   1st Qu.:2018   1st Qu.:3282  
 Mode  :character   4      : 18   Median :2020   Median :3762  
                    5      : 18   Mean   :2020   Mean   :3747  
                    6      : 18   3rd Qu.:2022   3rd Qu.:4224  
                    7      : 18   Max.   :2023   Max.   :6078  
                    (Other):232                                
     v_yld           mean_sev         v_sev           yld_check   
 Min.   :  4250   Min.   : 0.10   Min.   : 0.0000   Min.   :2506  
 1st Qu.: 30921   1st Qu.:10.00   1st Qu.: 0.9804   1st Qu.:3248  
 Median : 51914   Median :21.49   Median : 2.5969   Median :3405  
 Mean   : 65616   Mean   :25.27   Mean   : 6.8977   Mean   :3370  
 3rd Qu.: 84747   3rd Qu.:38.82   3rd Qu.: 8.4684   3rd Qu.:3598  
 Max.   :349261   Max.   :86.50   Max.   :64.2031   Max.   :4079  
                                                                  
  v_yld_check       sev_check      v_sev_check        log_sev      
 Min.   : 33766   Min.   :22.85   Min.   : 1.515   Min.   :-2.303  
 1st Qu.: 45616   1st Qu.:35.97   1st Qu.: 5.254   1st Qu.: 2.303  
 Median : 66773   Median :40.21   Median : 7.025   Median : 3.067  
 Mean   : 66173   Mean   :40.85   Mean   : 6.838   Mean   : 2.873  
 3rd Qu.: 85928   3rd Qu.:46.66   3rd Qu.: 8.461   3rd Qu.: 3.659  
 Max.   :111502   Max.   :52.68   Max.   :13.581   Max.   : 4.460  
                                                                   
     vi_sev               n2       
 Min.   :0.000000   Min.   : 4.00  
 1st Qu.:0.000399   1st Qu.:17.00  
 Median :0.001960   Median :18.00  
 Mean   :0.043301   Mean   :16.68  
 3rd Qu.:0.009596   3rd Qu.:18.00  
 Max.   :6.681174   Max.   :18.00  
                                   

Ajuste do modelo

Geral

# Overall

mv_sev <- rma.mv(log_sev, vi_sev,
  mods = ~ai,
  random = list(~ai | factor(study)),
  struct = "HCS",
  method = "ML",
  #control = list(optimizer = "nlm"),
  data = ma_sev)
Warning: 'V' appears to be not positive definite.
Warning: Ratio of largest to smallest sampling variance extremely large. May
not be able to obtain stable results.
summary(mv_sev)

Multivariate Meta-Analysis Model (k = 340; method: ML)

     logLik     Deviance          AIC          BIC         AICc   
-24040.6371   49723.0203   48095.2742   48122.0768   48095.6116   

Variance Components:

outer factor: factor(study) (nlvls = 22)
inner factor: ai            (nlvls = 3)

            estim    sqrt  k.lvl  fixed               level 
tau^2.1    0.0389  0.1971    135     no             AACHECK 
tau^2.2    0.1082  0.3289    132     no  BIX + PROT + TRIFL 
tau^2.3    0.1399  0.3741     73     no         FLUX + PYRA 
rho        0.5527                    no                     

Test for Residual Heterogeneity:
QE(df = 337) = 172800.5215, p-val < .0001

Test of Moderators (coefficients 2:3):
QM(df = 2) = 272.0872, p-val < .0001

Model Results:

                      estimate      se      zval    pval    ci.lb    ci.ub      
intrcpt                 3.7415  0.0421   88.9572  <.0001   3.6591   3.8240  *** 
aiBIX + PROT + TRIFL   -0.9501  0.0587  -16.1722  <.0001  -1.0652  -0.8349  *** 
aiFLUX + PYRA          -0.5919  0.0695   -8.5192  <.0001  -0.7281  -0.4557  *** 

---
Signif. codes:  0 '***' 0.001 '**' 0.01 '*' 0.05 '.' 0.1 ' ' 1
mv_sev_means <- emmprep(mv_sev)
library(emmeans)
Warning: package 'emmeans' was built under R version 4.1.3
mv_sev_emmeans <- emmeans(mv_sev_means, ~ ai)
pwpm(mv_sev_emmeans)
                   AACHECK BIX + PROT + TRIFL FLUX + PYRA
AACHECK             [3.74]             <.0001      <.0001
BIX + PROT + TRIFL   0.950             [2.79]      <.0001
FLUX + PYRA          0.592             -0.358      [3.15]

Row and column labels: ai
Upper triangle: P values   adjust = "tukey"
Diagonal: [Estimates] (emmean) 
Lower triangle: Comparisons (estimate)   earlier vs. later

Retorno em rendimento

emmeans_summary <- summary(mv_sev_emmeans)
emmeans_df <- as.data.frame(emmeans_summary)
colnames(emmeans_df) <- c("ai", "emmeans", "SE", "df", "lower.CL", "upper.CL")

emmeans_df$emmeans = exp(emmeans_df$emmeans)
emmeans_df$SE = exp(emmeans_df$SE)
emmeans_df$lower.CL = exp(emmeans_df$lower.CL)
emmeans_df$upper.CL = exp(emmeans_df$upper.CL)

library(multcomp)
Carregando pacotes exigidos: mvtnorm
Carregando pacotes exigidos: survival
Carregando pacotes exigidos: TH.data
Warning: package 'TH.data' was built under R version 4.1.3
Carregando pacotes exigidos: MASS

Attaching package: 'MASS'
The following object is masked from 'package:dplyr':

    select

Attaching package: 'TH.data'
The following object is masked from 'package:MASS':

    geyser
cld(mv_sev_emmeans)

Efic�cia

efficacy_sev <- data.frame(cbind(
  (1 - exp(mv_sev$b)) * 100,
  (1 - exp(mv_sev$ci.lb)) * 100,
  (1 - exp(mv_sev$ci.ub)) * 100
))

efficacy_sev